How to write Bar Chart IELTS Writing Task 1 Details from A - Z
You have mastered the strategy of doing the testBar Chart IELTS yet? How to write this Task 1 IELTS Bar Chart is different from other types of charts in IELTSis different? What knowledge do you need to remember about IELTS Writing Task 1 Bar Chart Vocabulary and what to note when writing Bar Graph IELTS? The following article will guide students on the best approach to the IELTS Bar Chart as well as provide a "super huge" sample stock for you to refer to and practice.

1. What is the Bar Chart format in IELTS Writing Task 1?
Bar Chart is a chart that uses columns (horizontal or vertical) to compare items against each other. Column charts usually have 2 axes:
- 1 vertical axis: Usually shows the values
- 1 horizontal axis: Usually describes objects
IELTS Writing Task 1 Bar Chart format includes 2 main types:
- Bar Chart Without Trend: Column chart has no change over time
- Bar Chart With Trend: Column chart changes over time
2. The steps to write Bar Chart descriptions have changed over time
Here, DOL will share with you how to write a column chart in IELTS that changes over time. Let's read together now!
2.1 Overview of Bar Chart form changes over time
For this type of bar chart, you only need to compare items or groups of objects with each other.
IELTS Writing Bar Chart Task 1 on July 23, 2022
2.2 How to write Bar Chart form changes over time
Introduction
In order to write an accurate introduction to the Bar Chart format , students need to analyze the question posed through the question words, 3W1H1H:
- WHAT does the chart show? (What information does this graph show) → Identify the object depicted.
- WHERE (Places and places are shown in the bar chart) → Identify the places mentioned in the chart.
- WHEN (Time mentioned in bar chart) → Defines the timeframe shown on the chart.
- HOW the data is shown? (In what form are the units of measurement expressed, usually as a percentage) → In the opening part of the IELTS Writing Task 1 column chart, the writer needs to make sure about the information: The object is described, where place, time, unit.
In addition, in the opening part of the column chart, you need to make the most of the Paraphrase methods in IELTS to complete the Introduction.

Suggest steps to write a Bar chart that changes over time
Eg:
Đề bài: The Bar Chart below shows the percentage of government spending on roads and transport in 4 countries in the years 1990, 1995, 2000, 2005.
- WHAT: The percentage of government spending on roads and transport
- WHERE: 4 countries
- WHEN: 1990, 1995, 2000, 2005
- HOW is the data shown: Percent (%)
→ Paraphrase cho đề bài trên: The Bar Chart illustrates how much the governments in 4 different countries spent on roads and transport in the years 1990, 1995, 2000 and 2005.
Overview
In the Overview section of the Bar Graph IELTS , the writer needs to be able to write 1-2 sentences to state the main and general characteristics of the data shown in the column chart.
Here, DOL will guide you how to write an Overview of the column chart in IELTS Writing Task 1. For the column chart that changes over time, the writer needs:
- Make a comparison of the highest data and the lowest data over each time period.
- Do a comparison of the object that shows the most prominence with the rest of the objects (or those with the least data) mentioned in the chart.
Eg:
→ Overview cho đề bài trên: Overall, it is apparent that Portugal has the highest governmental spending on road and transport while the UK possesses the lowest statistics among the 4 countries.

In the Overview section, candidates need to state the main characteristics of the data in the column chart
Body
One of the most effective approaches to Writing's bar chart format that shows change over time is to group information into two paragraphs in the body of the essay.
To do this, you need to perform analysis and chart analysis according to:
- The period (time period) with the highest or most prominent figures in a bar chart
- The remaining periods show similar data or have a sharp difference with the period mentioned.
Eg:
→ Body 1: Describe the 1990 figures
Specifically, Portugal’s government allocated more than a quarter of the total spending on transportation in 1990, which was about 5% percent higher than the second-highest spender - Italy, with 22 percent. Meanwhile the UK and the USA’s expenditures were significantly lower at 10 and 11 percent respectively, which were 2.5 times lower than that of Portugal.
→ Body 2: Describe the data for 1995, 2000, 2005
Regarding the changes over the years, the figures of Portugal declined steadil over the 15-year period to exactly 20 percent in 2005. In comparison, the corresponding figures from Italy and the UK also displayed a general downward trend throughout the studied period with the exception of a short increase in 2000.
In contrast, the expenditure figures of the USA demonstrated an upward trend , rising to 15 percent in 2005, despite dropping a minimal 1% in 1995.

IELTS Writing Task1 test on February 25, 2022
Learn more about common mistakes and notes when writing Bar Chart IELTS Writing Task 1 :
3. The steps to write a Bar Chart description do not change over time
3.1. Introduction Bar Chart does not change over time
With the IELTS Writing Bar Chart format , it shows changes over time, in addition to comparing items with each other. Candidates must also clearly show the increase and decrease of each item over time.

Bar chart that does not change over time is also a common form in IELTS Writing Task 1
3.2. How to write Bar Chart Format does not change over time
Introduction
Similar to the Bar Chart form that changes over time, in this section, DOL will guide the same writing for the opening form of the column chart:
In order to write an accurate introduction to the Bar Chart Writing section, students need to analyze the question posed through question words, 3W1H:
- WHAT does the chart show? (What information does this graph show) → Identify the object depicted.
- WHERE (Places and places are shown in the bar chart) → Identify the places mentioned in the chart.
- WHEN (Time mentioned in the bar chart) → Determine the time frame shown in the chart.
- HOW the data is shown? (The units of measurement are expressed in any form, usually percentage%) → In the opening part of the IELTS Wring Task 1 column chart, the writer needs to make sure about the information: The object is described, where place, time, unit.
Besides, similar to the Bar Chart format that changes over time, candidates also need to make the most of Paraphrases in IELTS to complete the opening part.

Suggest steps to write a Bar chart that does not change over time
Eg:
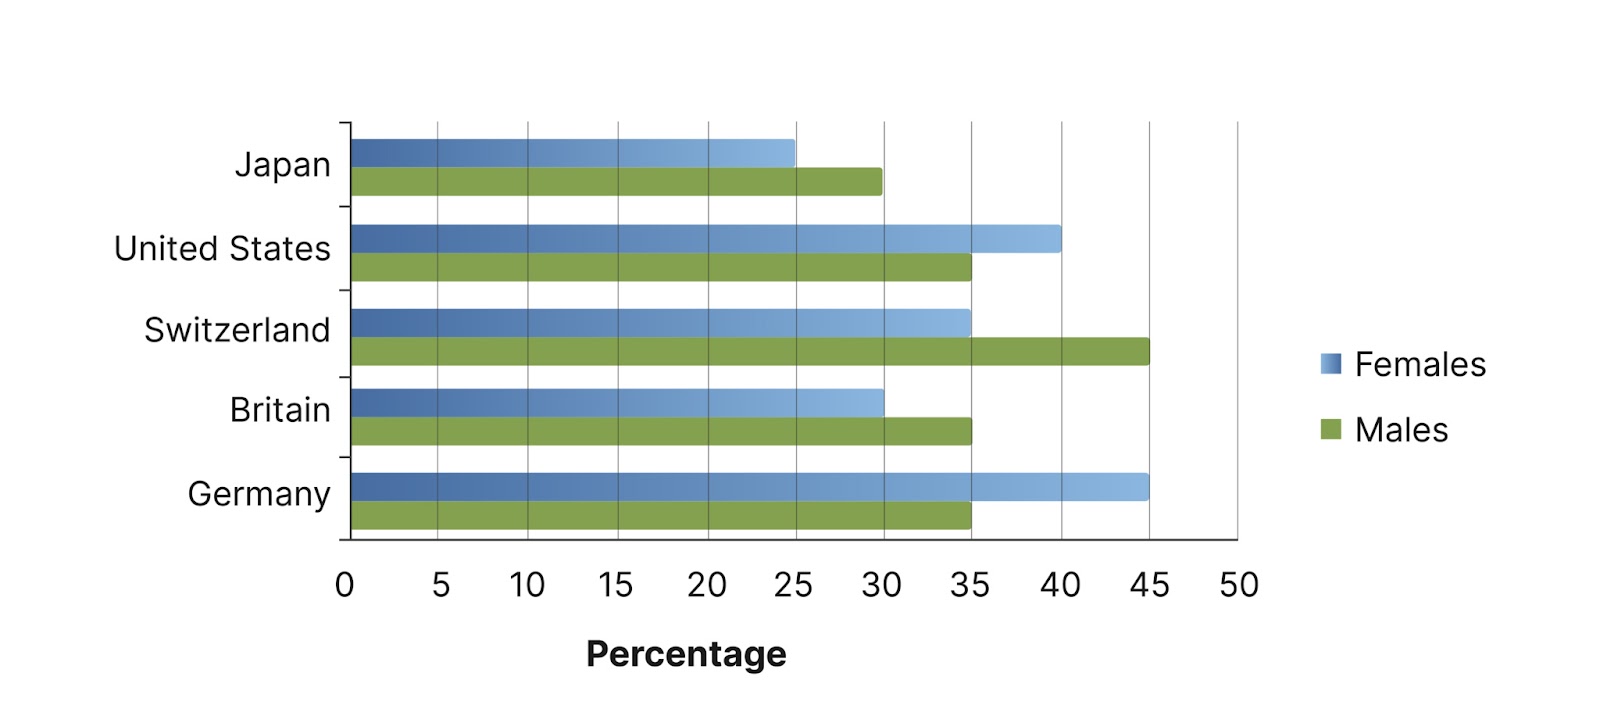
Đề bài: The chart below shows the percentage of males and females with higher education qualifications in five countries in 2001.
- WHAT: Male graduates and female graduates
- WHERE: 5 countries
- WHEN: 2001
- HOW is the data shown: Percent (%)
→ Paraphrase cho đề bài trên: The given Bar Chart illustrates the proportion of men and women in 5 countries who pursued higher education in 2001.
Overview
In the Overview section of the Bar Graph IELTS Writing Task 1 section , the writer needs to be able to write 1 to 2 sentences to state the main and overall characteristics of the data shown in the column chart.
For a column chart that does not change over time, the writer needs:
- Make comparisons of the highest and lowest figures of the target groups.
- Perform a comparison of the audience that shows the most general prominence about a field of information with the rest of the subjects (or subjects with the least number) mentioned in the chart.
Eg:
→ Overview cho đề bài trên: It can be seen that Germany and Switzerland had the highest percentage of males and females having higher education qualifications. In addition, the percentage of women holding degrees in higher education in Japan was the lowest among the surveyed categories.

Bar Chart IELTS samples have not changed over time
Body
In this part, DOL will guide you how to write the column chart form of IELTS Writing Task 1 that does not change over time, which is to group information into two paragraphs in the body of the essay.
To do this, you need to perform the analysis and analysis of the chart by: Group of information or main object group is shown in the column chart through comparing the data with each other.
→ Body 1: Describe the data on male graduates
With regard to male graduates, Germany, the UK, and the US shared the same figure of 35% - the lowest number recorded in this category. At the same time frame, the proportion of men pursuing higher education in Switzerland was the highest (45%) which was 5% more than that in Japan.
→ Body 2: Describe the data of female graduates
In terms of female graduates, the leading position was German with 45% of its women following higher education, and only one-quarter of Japanese fellows were graduates of tertiary education. The United States followed the trend in female graduation with a percentage of 40%. The proportion of females with higher degrees in Britain and Switzerland was 30% and 35%, respectively.

The steps to write articles in the Bar Chart format do not change over time similar to the form with changes over time
The approach to the column chart will have to be the same as the approach to any chart type in Writing Task 1. You need to look at the information and think carefully: The best way to summarize how information is structured And what are the main points? From there, how can the most relevant pieces of information be compared? Finally, how should the summary and comparison be structured?
Watch more videos on how to write Bar Chart IELTS Writing task 1 below:
4. Some sample IELTS Writing Task 1 Bar Chart Sample
Let's take a look at some Bar Chart IELTS samples with DOL below!
4.1 Topic 1 : The type of column chart changes over time
Question: The chart below shows the percentage of the population in the UK who consumed the recommended daily amount of fruit and vegetables in 2002, 2006 and 2010.

IELTS Writing Task1 exam on April 23, 2022
Answer:
Introduction: The given Bar Chart illustrates the proportion of British people who consumed the suggested amount of fruit and vegetables on a daily basis in three years: 2002, 2006 and 2010.
Overview: Overall, it can be seen that British women’s consumption of fruit and vegetables was far higher than the two remaining groups.
The initial impression from the graph is that the percentage of the recommended amount of fruit and vegetables every day that the British of both genders, namely male and female, consumed was nearly similar. Regarding men, their consumption shared the same pattern in 2002 and 2010 with roughly 23%.
Body 1: In 2010, both figures for men's and women’s consumption of fruit and vegetables reached the highest point at 27% and 32%, respectively. The recommended daily amount of fruit and vegetables consumed by women living in the UK was 25% in 2002 and rose slightly by 2% at the end of the period.
Body 2: In 2002, children’s daily consumption of fruit and vegetables was much lower than the other groups with approximately one-tenth, which was half of the women’s and men’s consumption in the same year. In the next 4 years, the figure rose to 16% before dropping by 2% in 2010.
4.2 Problem 2 : Column chart type does not change over time
Question: The charts below show the Internet use in different purposes in Australia in 2010,2011 and the percentage by users.

IELTS Writing test on 12/05/2022
Answer:
Introduction: The given chart illustrates data on the proportion of Australian Internet users who has various objectives in using the platforms in 2010 and 2011 and their age group was also reported.
Overview: Overall, it can be seen that most young Internet users in the country are in favor of using social media and a large proportion of people who used the Internet for emailing has been recorded.
Body 1: In terms of purposes, while emailings was the feature that attracted a majority of Internet users with 70%, there was a moderate percentage of people (approximately 50%) who exploited the Internet for social media use and paying bills online.
Body 2: Regarding age group, the older generation (65+ years old) prefers using email and paying bills online whereas almost 100% of young people aged between 18 - 25 use social media. In addition, there were only 27% of old-aged Internet users, which was nearly 3 times lower than the percentage of the younger group.
DOL English is always ready to accompany you to conquer all IELTS Writing Task 1 Bar Chart questions, even the most "difficult"
5. Frequently Asked Questions
In the above content, DOL shared the IELTS Writing Task 1 Bar Chart sample . Following are the answers to some frequently asked questions, please refer to:
What are the basic criteria for the examiner to score the Bar Chart IELTS test ?
- Task response : Did the candidate answer the question correctly?
- Coherence And Cohesion : During the marking process, the examiner will consider whether the candidate's writing has a close, logical, coherent connection between ideas and sentences.
- Vocabulary (Variety of Vocabulary): The examiner will have a better impression if candidates use phrases and words correctly, with correct spelling, and diverse vocabulary, correct tenses, and correct grammar.
Suggest some sentence structures commonly used in Bar Chart IELTS
- Time, S + V + Adv (Verbs with adverbs)
- There + tobe + a/ an + N
- S + saw/ witnessed / underwent
- A/ an + N was recorded/ seen
- Before/ After + Ving, S + V + Adv
- S + V + Adv, Then V + more Adv (The same direction)
- S + V + Adv, but then V + more Adv (The opposite directions)
- There was a/ an + Adj + N, which was followed by a/ an adj + N
Common mistakes and notes while writing Writing Task 1 Bar Chart
- Failure to determine the correct format of the article and not carefully reading the requirements of the topic.
- Do not use linking words in the writing process, making the article become disjointed and lacking in links.
- Using the wrong vocabulary to describe objects in the Bar Chart.
- The layout of the article is not clear, the introduction, body, and conclusion are not clear
The above article has pointed out the common types of IELTS Writing Task 1 Bar Chart . Along with that, there are mistakes in writing and how to apply Linearthinking to make this type of article complete.
Thereby, DOL hopes you have a more general view of the Bar Chart form and achieve a higher score when encountering this type of post. Good luck with your exam study!


Nhận xét
Đăng nhận xét