How to Write Line Graph In IELTS Writing Task 1
Line Graph is one of the most popular chart types in IELTS Writing Task 1. So what is the nature of this type of test? The following article will analyze in depth the different forms of the article IELTS Writing Task 1 Line Graph. At the end of the article, DOL will provide a "super huge" Writing Line Graph practice test for your reference and practice!

DOL IELTS Dinh Luc
Nov 05, 2021
2 mins read

1. Identify Line Graphs in IELTS Writing Task 1
Line Graph It is a chart with 2 vertical and horizontal axes. In particular, the horizontal axis often represents different timelines. When taking the Line Graph test, candidates need to be able to see and describe how the subject has changed over time.
Line Graph is a common type of question in Writing Task 1 IELTS
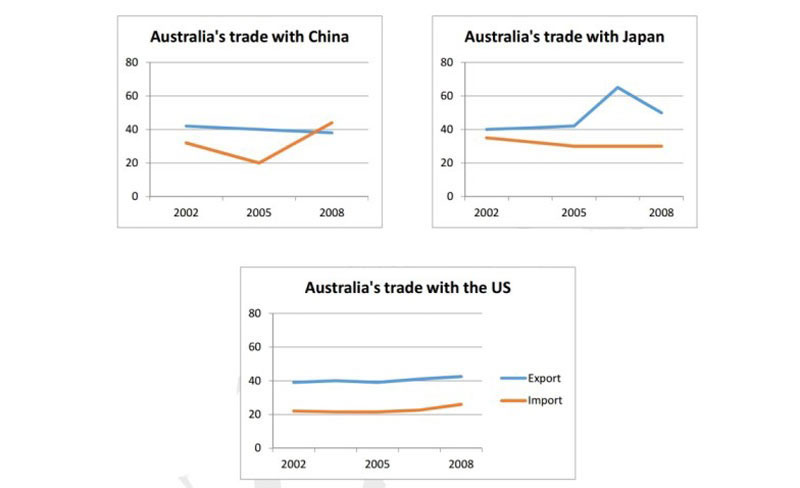
Eg: TopicsIELTS Writing Task 1 Line Graph April 21, 2022
The graph shows the amount of fruit produced in four countries (France, Spain, Germany, Turkey) from 1970 to 2010.

Line Graph IELTS Writing Task 1 on April 21, 2022
2. How to write IELTS Writing Task 1 Line Graph
Before I start writingLine Graph IELTS Task 1 To be complete, the writer needs to distinguish two types of Line Graph to apply the corresponding chart analysis. From there, there is a suitable treatment method.

How to write IELTS Writing Line Graph
There are 2 main types of IELTS Line Graph:
- FormIELTS Line graph have less 3 lines
- FormIELTS Line graph there are more 3 lines
2.1 Line Graph form with 3 lines
Writing IELTS Task 1 Line Graph there are 3 lines (or less than 3) in the form of a histogram with little data. Therefore, when performing the description, the writer needs to flexibly report the data in more detail than the other chart type.
Line Graph IELTS has 3 lines
Eg:
Topic: The graph below compares changes in the birth rates of China and the USA between 1920 – 2000.

IELTS Task 1 Line Graph topic for November 20, 2021
To write an articleWriting IELTS Task 1 Line Graph complete and quality for the above chart, you can perform chart analysis and complete the article by following the steps below:
Step 1: Look closely at the chart, identify the basic metrics (number of lines, objects, timeline, graph description).
- Description of the chart: The graph depicts the change in fertility rates in China and the US
- Number of lines: 2 way
- Objects: US, China
- Timeline: 1920 - 2000 → Use Past Simple(Past Simple)
Step 2: Explain(Paraphrase) the description in the title to write the introduction(Introduction).
Topic
The graph below compares changes in the birth rates of China and the USA between 1920 – 2000
Opening
The graph displays the difference in birth rates between China and the USA from 1920 to 2000.
The words have been replaced:
- Compares - Displays
- Changes - Difference
- Between 1920 and 2000 - From 1920 to 200
Step 3: Select the data to be depicted in the chart and make an outline.
Overview: Candidates should write 2 sentences for this passage. In which, 1 sentence shows the general trend of the lines and 1 sentence compares the lines.
"Both figures fluctuated dramatically" >< "They displayed a downward trend throughout the studied period"
Body Paragraph 1: Describe the tendency of the lines to change and compare the magnitude.
- 1920 - 1945:
↳ 1920: The birth rates of China and the USA started at a relatively similar position.
↳ Over the next 15 - year period: Both figures varied considerably.
Body Paragraph 2: Describe the tendency of the lines to change and compare the magnitude.
- 1945 - 2000:
↳ A remarkable rebound: China hitting a peak of 20 and the USA following at 15.
↳ Between 1955 and 2000: The birth rate of China took a plunge to 2 while that of the USA declined gradually to 7 by the end of the century.
Note:
- With a graph with only one line, the candidate needs to choose a timeline to divide the entire time into 2 periods.
- In Body Paragraph 1 the contestant needs to describe the changing trend of the data in the early period. Body Paragraph 2 depicts the rise and fall during the second half of that period.
Step 4: Based on the outline, connect the ideas into complete sentences and paragraphs
Complete article:
Introduction: Overall, it is clear that even though both figures fluctuated dramatically, they displayed a downward trend throughout the studied period.
Overview: In particular, the birth rates of China and the USA started at a relatively similar position of around 10 in 1920. Both figures varied considerably over the next 15-year period before dropping sharply during the 1940 to 1945 period with China bottoming out at 5 and the USA at around 7.
Body 1: The next 5 years witnessed a remarkable rebound with China hitting a peak of 20 and the USA following at 15. These numbers are four times and two times, respectively, greater than the lowest figures from both countries.
Body 2:However, between 1955 and 2000, the birth rate of China took a plunge to 2 while that of the USA declined gradually to 7 by the end of the century.
Watch the following video to learn more about how to do this postLine Graph IELTS This works really well:
2.2 Line Graph form with more than 3 lines
FormIELTS Task 1 Line Graph there are more than 3 possible lines up to a maximum of 5 - 6 lines. So the data contained in this chart is twice as much as the cards below the 3 lines mentioned above.
Therefore, the way information is divided in the body paragraph must also be adjusted. Here, the writer needs to divide the body paragraph by the number of lines:
- Introduction and Overview:There is no change from the less than 3 line hand.
- Body Paragraph 1: Describe the trend of the lines and compare the lines with the same uptrend/downtrend or similar value in magnitude.
- Body Paragraph 2: Describe the trend of the lines and compare the remaining lines.
Let's practice detailed analysis with DOL and write a complete report for this chart type following the same steps above!
Eg:
Topic: The graph shows the amount of fruit produced in four countries (France, Spain, Germany, Turkey) from 1970 to 2010.

IELTS Writing Task 1 Line Graph on April 21, 2022
Step 1: Look closely at the chart, identify the basic metrics (number of lines, objects, timeline, graph description).
- Description of the chart: The chart shows how much money the US government spends on different categories.
- Number of lines: 5 way
- Objects: Health, Space, Energy, General Science, Other
- Timeline: 1980 - 2008 → Use Past tense(Past Tense)
Step 2: Paraphrase the description in the title of the chart to write the Introduction.
Topic
The graph below gives information about US government spending on research between 1980 and 2008.
Opening
The graph presents information on different sectors whose researches were subsidized by the US government over the course from 1980 to 2008.
The words have been replaced:
- Gives information about - Presents information on
- US government spending on research - Different sectors whose researches were subsidized by the US government
- Between 1980 and 2008 - Over the course from 1980 to 2008
Step 3: Select the data to be depicted in the chart and make an outline.
Overview: Candidates should write 2 sentences for this passage. In which, 1 sentence shows the general trend of the lines and 1 sentence compares the lines.
- Overview can be written as follows:
↳ The amount of fruit produced in Spain always took the leading position.
↳ While fruit production in France and Turkey increased, that in the two remaining nations experienced a drop.
Body paragraph 1: Describe the trend of the lines and compare the lines with the same uptrend/downtrend or similar value in magnitude.
- Spain:
↳ 1970: 5.5 million tonnes of fruit were produced compared to 3.5 million in Germany
↳ 1980: The figure in Spain rose to reach the top before decreasing
- Germany:
↳ 1990: The amount of fruit yielded in this country went down gradually
↳ The following years: The number remained stable in the next 10 years before dropping by 0.25 million tonnes in 2010.
Body paragraph 2: Describe the trend of the lines and compare the remaining lines
- 1970:
↳ France supplied the least amount of fruit.
↳ The figure recorded in Turkey was 2 million.
- The following years:
↳ Fruit yield in Turkey grew gradually.
↳ The amount of fruit produced in France saw a decrease before rising at the end of the period shown.
Step 4: Based on the outline, connect the ideas into complete sentences and paragraphs.
Complete article:
Introduction: Overall, it can be seen that the amount of fruit produced in Spain always took the leading position among the four countries. In addition, while fruit production in France and Turkey increased, that in the two remaining nations experienced a drop during the same time frame.
Overview: The initial impression from the graph is that in 1970 roughly 5.5 million tonnes of fruit were produced in Spain, compared to 3.5 million in Germany. 10 years later, the figure in Spain rose to reach the top of more than 6 million before decreasing slightly to 5 million at the end of the period.
Body 1: Regarding Germany, the amount of fruit yielded in this country went down gradually to 1.5 million tonnes in 1990. However, the number remained stable in the next 10 years before dropping by 0.25 million tonnes in 2010.
Body 2: In 1970, France supplied the least amount of fruit (1.2 million tonnes) whereas the figure recorded in Turkey was 2 million. In the following years, fruit yield in Turkey grew gradually to reach 3.5 million tonnes in 2010. Besides, the amount of fruit produced in France saw a decrease of 0.2 million tonnes in 2000 before rising to 2.8 million at the end of the period shown.
The main task of IELTS Writing line graph is to write a 150 word report describing the data given in the line graph. Candidates are not asked to give their opinion.
Remember, Task 1 doesn't have as much score value as Task 2 and so should only spend a maximum of 20 minutes on IELTS Writing Task 1.
You can see more academic vocabulary for the formIELTS Writing Line Graph in the video below:
3. Common mistakes when writing IELTS Line Graph
When writing analysisIELTS Writing Task 1 GraphStudents often make the following mistakes:
3.1 Missing out on important data when writing
- Lee do: This is a common problem in the process of candidates describing the IELTS Writing Task 1 Line Graph chart. Mainly because candidates usually only pay attention to describe first year and final year data. Then miss important metrics in the middle of the process.
- Solution: Use thinkingLinearthinking to efficiently filter information instead of selecting data at random.

Common mistakes when writing Line Graph IELTS
3.2 Failed to clarify the comparison between objects
- Lee do: This problem often occurs when candidates describe the line graph in IELTS mechanically. Only focusing on showing the increase and decrease between objects without comparing the difference between them.
- Solution: Use thinkingLinear Thinking to structure the article properly. Both describe the increase and decrease, as well as clarify the comparison.
3.3 Using the wrong tense in the article
- Lee do: Many candidates when writing do not pay attention to the given time. Mainly use only the past tense with Line Graph IELTS.
- Solution: Always carefully observe the timeline before writing to choose the right one. Avoid unnecessary grammatical errors in the article.
Readers can learn more about the Linearthinking method to apply in writingWriting Task 1 IELTS Line Graph in the following video:
4. IELTS Writing Task 1 Line Graph Sample
Here are somebài mẫu IELTS Writing Task 1 Line Graph that DOL has compiled, let's take a look!
4.1 Lesson 1 - Line Graph IELTS more than 3 lines
Topic: The graph shows the percentage of people accessing news from 4 sources: TV, Radio, Newspaper, Internet.

Line Graph IELTS Sample: The graph shows the percentage of people accessing news from 4 sources: TV, Radio, Newspaper, Internet
Assignment:
Introduction: The graph illustrates the popularity of 4 different news sources in percentage between 1995 and 2025.
Overview: Overall, it is clear that TV has been people’s main source of news until 2020, while the Internet has had a significant surge in popularity. Additionally, the Internet is the only media that is getting more favored while the other sources are losing popularity over time.
Body 1: In 1995, TV started at the top with 70% of the surveyed population using it for getting news, and Newspaper and Radio got 57% and 52%, respectively. The popularity of these three sources has decreased through the years, with TV losing 20% by the end of the period and Newspaper and Radio’s figures are expected to be halved.
Body 2: In contrast, the Internet has displayed an upward trend since 2000. While at the beginning, the figure for the Internet was zero, it has rocketed from roughly 2% in 2000 to 40% by the end of 2020. It is forecasted to continue its uptrend and replace TV as the main source for acquiring news, with 55%, in 2025.
4.2. Lesson 2 - IELTS Line Graph with 3 lines
Topic: The line graph below shows the production of paper, wood pulp and sawn - wood in the UK from 1980 to 2000.

Bài mẫu IELTS Writing Task 1 Line Graph: Line graph shows the production of paper, wood pulp and sawn - wood in the UK from 1980 to 2000
Assignment:
Introduction: The line graph delineates the production of forest industry in the UK spanning from 1980 to 2000.
Overview: As is shown in the graph, paper and packaging was produced the most in three years surveyed. It is also clear that this product showed overall growth over the years whilst the opposite was true for the other two categories.
Body 1: In 1980, the production of paper and packaging stood at around 230 million tonnes, outnumbering other two figures for sawn - wood (200 million tonnes) and wood pulp (approximately 160 million tonnes). 10 years later, there was a noticeable rise to 250 million tonnes in the amount of paper and packaging produced, which was followed by a surge of 100 million tonnes in 2000.
Body 2: On the other hand, sawn - wood production witnessed a steep decline, reaching its lowest point of 130 million tonnes in 2000. Wood pulp showed not much of a difference with only a negligible dip in 1990 before recovering to finish off at less than its original figure a bit.
>> See more:Warehouse of exam practice questions IELTS Writing Task 1 with all kinds of articles
Explore moreIELTS Writing Task 1 Line Graph Sample in the document below:
5. Frequently asked questions
How to summarize a Line Graph in IELTS?
What are the steps to write a Line Graph in IELTS?
What kind of data is represented in a Line Graph?
What is the purpose of a Line Graph?
The above article has shown the types ofIELTS Writing Task 1 Line Graph common. The same common mistakes when writing this form and how to apply itLinearthinking to make this post complete.
Thereby, DOL hopes you have a better overview of the IELTS Line Graph format and get a higher score when you meet this test easily. Good luck with your exam study!


Nhận xét
Đăng nhận xét